One of my favorite book series is The Dark Tower, by Stephen King. Forget about the movie, it doesn’t do it any justice. We have a collection of eight books and one short story telling an epic tale of the gunslinger and his group of friends, his ka-tet, moving towards the Dark Tower, with more than four thousand pages, while dealing with the infamous man in black.
From Wikipedia:
The Dark Tower is a series of eight books and one short story written by American author Stephen King. Incorporating themes from multiple genres, including dark fantasy, science fantasy, horror, and Western, it describes a “gunslinger” and his quest toward a tower, the nature of which is both physical and metaphorical. The series, and its use of the Dark Tower, expands upon Stephen King’s multiverse and in doing so, links together many of his other novels.
Besides that, we will also take a look at the poem that inspired Stephen King to write this series, “Childe Roland to the Dark Tower Came” by Robert Browning.
| Order | Title | Pages | Words | Release Year |
| 0 | Childe Roland to the Dark Tower Came | 6 | 1,761 | 1855 |
| 0.5 | The Little Sisters of Eluria | 66 | 23,434 | 1998 |
| 1 | The Gunslinger | 224 | 55,376 | 1982 |
| 2 | The Drawing of the Three | 400 | 125,948 | 1987 |
| 3 | The Waste Lands | 512 | 173,489 | 1991 |
| 4 | Wizard and Glass | 787 | 254,691 | 1997 |
| 4.5 | The Wind through the Keyhole | 336 | 91,857 | 2012 |
| 5 | Wolves of the Calla | 714 | 242,776 | 2003 |
| 6 | Song of Susannah | 432 | 118,221 | 2004 |
| 7 | The Dark Tower | 845 | 272,273 | 2004 |
| The Dark Tower series | 4,316 | 1,358,065 |
Word clouds
To get some insights from the series, we will generate graphs showing the most frequent words in each book. One special kind of visualization that can help us is the word cloud. Again, from Wikipedia:
A tag cloud (word cloud or wordle or weighted list in visual design) is a novelty visual representation of text data, typically used to depict keyword metadata (tags) on websites, or to visualize free form text. Tags are usually single words, and the importance of each tag is shown with font size or color.
What does that mean? A word cloud is a collection, or cluster, of words depicted in different sizes. The bigger and bolder the word appears, the more often it’s mentioned within a given text and the more important it is.
Data set
We want to visualize the frequency of the most common words in this series of books. We will generate a graph for each book and another for whe whole body of text. Our input data is composed of ten text files, one for each title.
We won’t be doing any exploration analysis, but we have some guesses of what we expect as the most relevant words. For the poem, we don’t have any prior knowledge. The first book is mainly a solo story, with the gunslinger follows the man in black and meets the boy Jake. For the other books, gunslinger and Roland are the main ways the main character is referred to. His companions are Jake, Eddie, Susannah and their pet Oy. This group is moving towards the Dark Tower. The short story and some of the books are recollections of memmories from Roland, so other names will pop up.
Creating word clouds
There are Python libraries designed to create this visualizations, so the process to build them is very straightforward. We will describe the step-by-step for the first text and then present the images for every book.
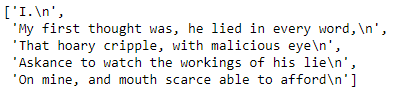
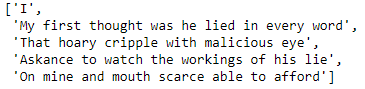
Our input needed is a a string with the collection of every word of the text. So we need to do some data cleaning, removing everything that isn’t alphanumeric. That means all the punctuation and special coding characters, like ‘\n’, that denotes a new line. We also turn everything to lowercase.

With this long string with all the words, we can create our first word cloud for the poem ‘Childe Roland to the Dark Tower Came‘.
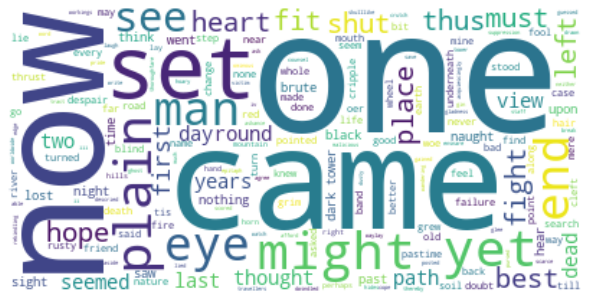
The main words are one, now, came, and set. Nothing much can be learned from this.
Let’s see what the other texts show!
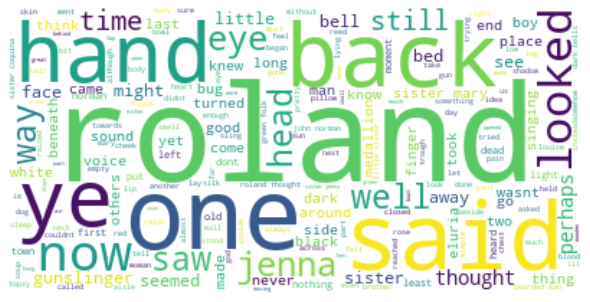
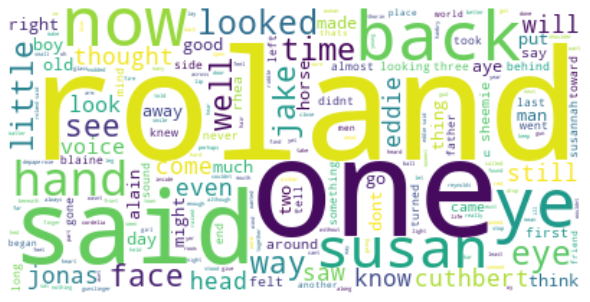
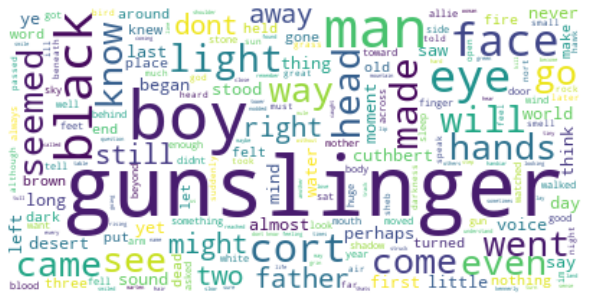
The most relevant word now is roland, what makes a lot of sense. Said, back, one, hand and ye are the next ones. We can see gunslinger is important.
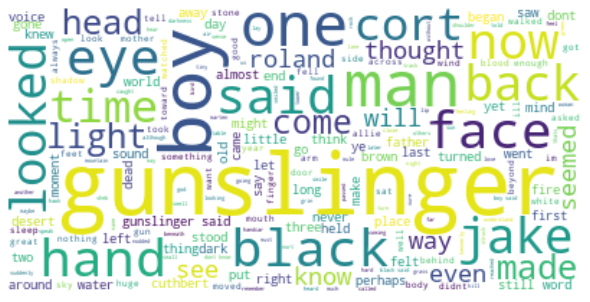
Gunslinger is how Roland is called by most people he meets while following the man in black. In this book, Roland meets Jake, the boy who will accompany him until the end.
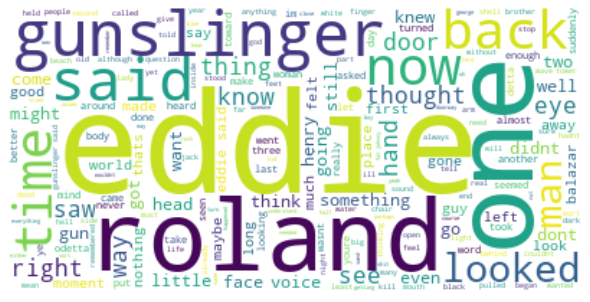
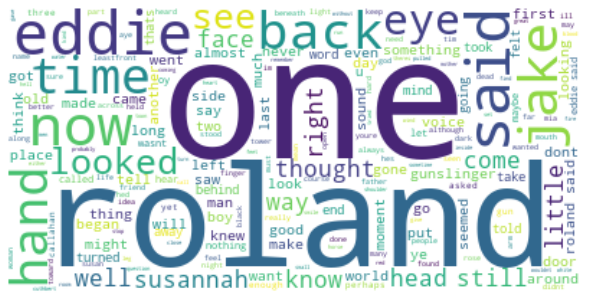
The new characters are starting to show. Eddie, Roland and gunslinger are the most relevant words.
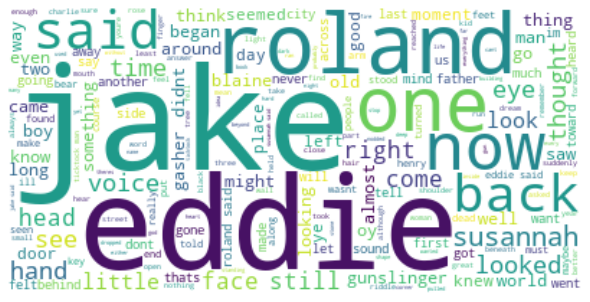
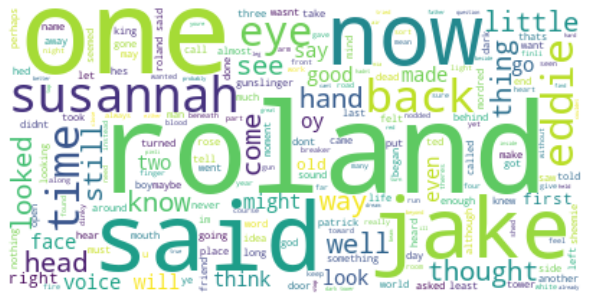
Now we have our whole group: Roland, Jake, Eddie e Susannah (smaller). As they talk to each other during their journey, their names will be more frequent in the text.
In this book, Roland is telling his back story, so we see less of his companions. We see Susan, Jonas and Cuthbert, his old friends.
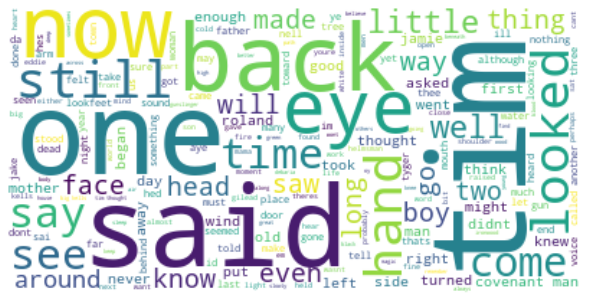
Roland tells the tale of Tim Stoutheart to his friends. There are no remarkable words.
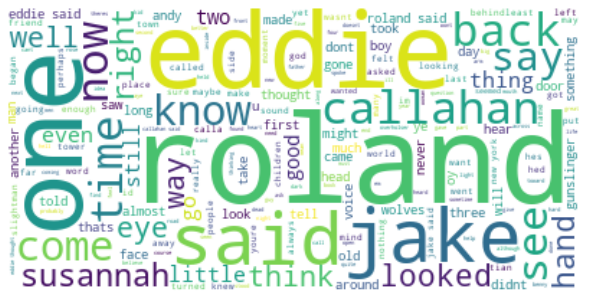
Again we have our major characters, but now Father Callahan shows up.
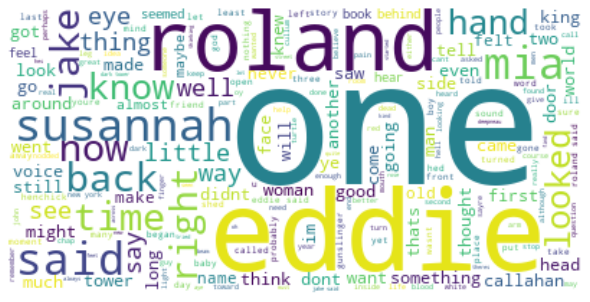
We see the name of the demon Mia who is responsible for the possession of Susannah.
We come to the last book, and we see most of the words being repeated book after book.
Filtering
We have some words that show up in most of the graphs, but don’t bring any insight to the story. One, back, said, now, time, hand, thought and looked will be added to a list of words that aren’t considered for the visualization. These are known as stopwords, such as the and and, who are used too frequently to be of any help to the graph.
Let’s also remove the name of the four main characters: Roland, Jake, Eddie and Susannah. Most of the time they are talking amongst themselves, so their names are too frequent.
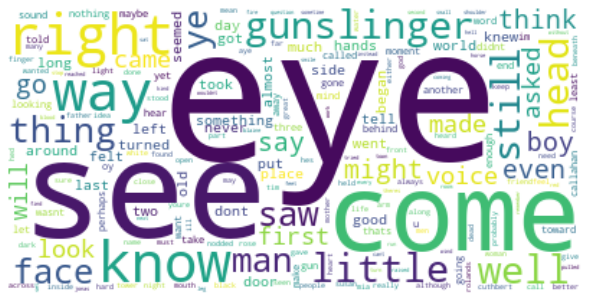
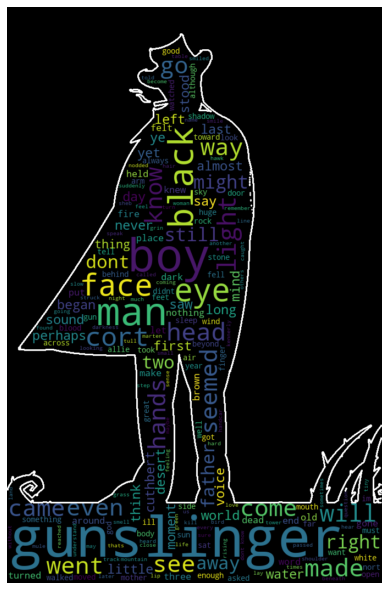
We could keep adding words to the list, but there is no end to that. Let’s take a look at the first book again.
We can improve it a little further by adding a mask to the graph.
Conclusion
This is a data visualization exercise. There are eight books and one short story following the journey of a group of four people towards the Dark Tower. It is a small set of main characters, so we should remove their names to be able to get some new insights.
Final conclusion: we can present the distribution of relevant words for the Dark Tower Series in a pleasing and insightful visualization.
Jupyter Notebook available at Github. Interactive panel at Tableau Public.