We are currently on the second year of the Coronavirus pandemic. It is obvious the institutions aren’t ready to face extreme conditions for a prolonged period of time, and neither are the people. While there is a large community of paranoid people in the US who are ready to survive the extinction of civilization, in Brazil this scenario is not something we consider when thinking about the future.
Brazil is a country with continental dimensions, with more than 220 million people spread over 8.5 million square kilometers. There must be some dark forgotten places where one could ride out an extinction level event. There are more than five thousand cities and we will sort through different types of data to determine the best places to enjoy the end of the world.
After ranking the cities from best to worst, we will try to optimize our escape route, choosing our starting city and defining the sequence of cities to get to our final destination.
Definition of the problem
There are several different causes for an apocalypse, and people are getting more creative everyday. Zombies, nuclear war, large asteroids, deadly viruses, global warming, exploding volcanoes, massive earthquakes, alien invasion! Although there are huge variations on each of these scenarios, we can look for some information that will help no matter what comes our way.
Crowded places should be avoided, food must be plentiful, fresh water must be available. We also need medication to cure and prevent diseases, and firearms for protection. It would be smart to be away from nuclear power plants, but solar energy might be useful. Average temperatures around 22 degrees are a good choice. Being close to an airport should be interesting, even a small one, for a quick getaway, if you can find and fly a plane.
We should also be worried about learning new abilities to survive and perhaps rebuild civilization, so we also looking at libraries and universities.
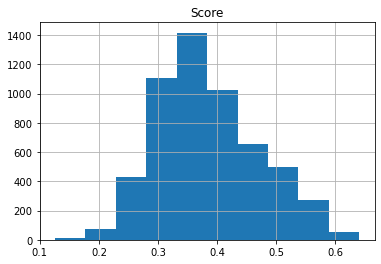
We will load data that helps to determine the potential for each city to fulfill one of this requirements, describing its source and how we create a metric to rank the cities. After processing all this information, our final data set will be a table where each row is a city and each column will show a score between 0 and 1 for a certain feature. Our last feature will be the sum of all scores, and we will rank the cities by this metric. Hopefully, we will have a clear winner for the whole country.
We also have a list of neighboring cities for each location. So we can map a route from any place to the our sanctuary or try to find the best place at a certain distance from a starting point.
The common feature to all the data will be an ID given by the Brazilian Institute of Geography and Statistics, IBGE. This unique ID has six digits, but sometimes databases add an extra number at the end.
Extraction, Transformation and Loading of the Data
We are gathering here several different information for each Brazilian city. They were all gathered after a long, hard search through several government websites and other sources. We will list here the sources used and the relevant info we are interested in. Some data was processed before loading here, because of typos or clearly wrong information (Porto Alegre was placed in RN in one of the files).
2013 Brazilian Human Development Atlas, available at Atlas Brasil. Here we get the city ID, city population and the Health component for the 2010 HDI.
Territorial Data from IBGE – Brazilian Institute of Geography and Statistics, available at Áreas Territoriais. This gives us the area of each city.
Tabnet – DataSUS, at Tabnet. We have the number of hospital beds available at each city.
National Energy Agency, here. Here we have the data with the location and energy production of all the power plants in the country. Here we will keep only four types of energy production: solar, wind, biomass and nuclear power. Solar power is easy to maintain, Biomass is a nice alternative, Wind turbines should work for a long time without maintenance, and Nuclear power should be as far away as possible, because it fill fail without the proper care. Hydroelectric power plants are too complex to maintain, and thermoeletric are dependent of fuel.
INPE – National Institute for Space Research released the 2017 Brazilian Solar Power Atlas. Here we get the solar incidence that will be used for the climate Index and also the geographical coordinates for each city.
Forest-GIS, here. We have the climate information for each city: the average temperature and the standard deviation during the year, the rainfall and the altitude
SIDRA, IBGE’s Automatic Retrieval System, with two inputs, one for the production at permanent farms and another for the temporary productions.The information we are seeking here is the area being used for plantations, and we will use that as a proxy to determine how fertile the region around the city is.
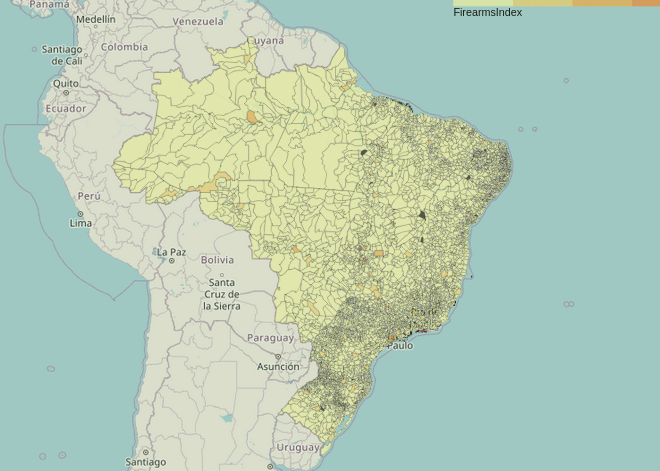
Municipal Basic Informations Research (MUNIC) – IBGE, available here. We couldn’t find information about gun possession, so we will use the number of police stations as a proxy.
Wikipedia has a lot of information to be processed. Here we are interested in the list of Military Bases and Airports.
Higher Education Census – IBGE, available here, with the information from all entities registered as Higher Education at the Ministry of Education.
Public Libraries National System has a website that gathers the data from the State Secretaries and all the public libraries.
Basedosdados.org is a very good source of clean data sets, including one with the list of neighboring cities.
GeoDataBR is a GitHub project offering geojson files with the shape of the Brazilian cities.
From the 5565 cities, we have all the info for 5532 of them. This represents 99.6% of the area of the country, so we can assume our results won’t be hindered by this.
Creating the Human Survival Index – HSI
Following the example of the Human Development Index, we are going to create several sub-indexes that relate to important aspects needed for our survival.
We are ready to create our final Human Survival Index! We have eight components, and they are separated in two groups: the ‘must have‘ (People, Food, Climate and Isolation), and the ‘nice to have‘ (Knowledge, Escape, Firearms and Power). Our HSI will be the weighted average of all indexes, with the first group worth double.
I currently live at Rio de Janeiro, which is 2736th city if we rank them by the HSI.

Not great, not terrible. Rio de Janeiro is in the first half of our list, but we see that three of our ‘must have‘ are zero or really low. It seems that, when the individual indexes are not zero, they are really high.
Planning an Escape Route
We finally get to the fun part! We have the HSI score for all cities and we have the list of neighbors. A city will be selected as a starting point and then we will simulate a great number of agents trying to escape from there. We will use a method known as simulated annealing to optimize our escape. The algorithm works as follows:
- We define a number of steps the optimization will take;
- From the chosen city, we will create a list of its neighbors;
- We will randomly pick one of the neighbors as our target for a move, using their scores as weights;
- If the Score for the target is higher than our current city, the move is made;
- If the Score for the target is lower than current city, there is a probability of making the move anyway, and it depends on the difference between Scores and how many steps have been taken by the optimization;
- This process is repeated for each step.
This algorithm is very interesting because it allows the system to go to worse cities in order to explore a larger part of the domain. But it also reduces the probability of this move as the algorithm runs, what makes the agent take more risks at the beginning.
We will have three results:
- A heatmap showing how many agents visited each city;
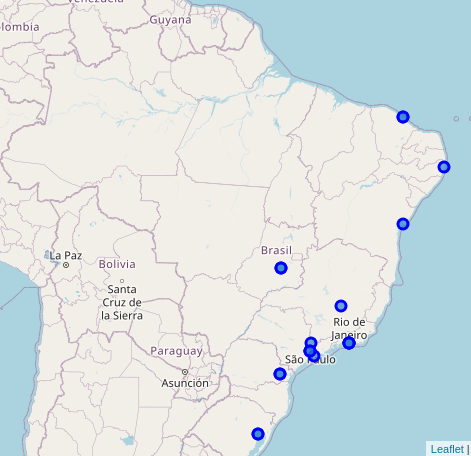
- The escape route that ends with the highest score from all the simulations;
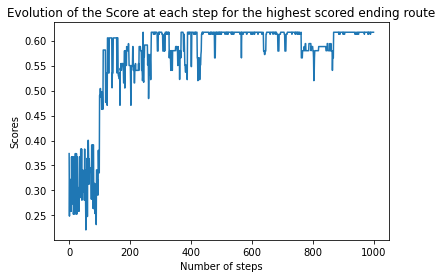
- The evolution of the Score for this route.
This might not be the best possible solution, because it is probable it has some steps without moving and it is possible it has closed loops before moving along. It is also possible to reach the better cities and move out from them.
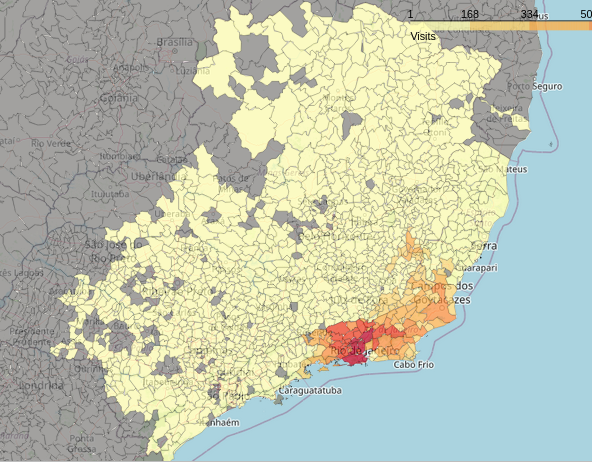
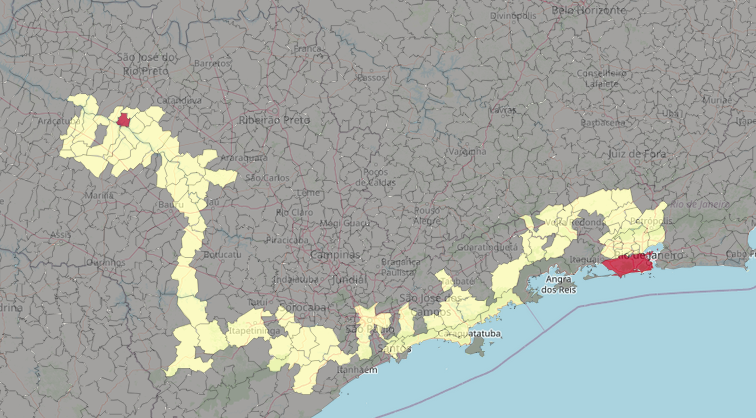
Our simulation lead us to the tenth city in our ranking! Not the ideal solution, but pretty close.

Conclusion
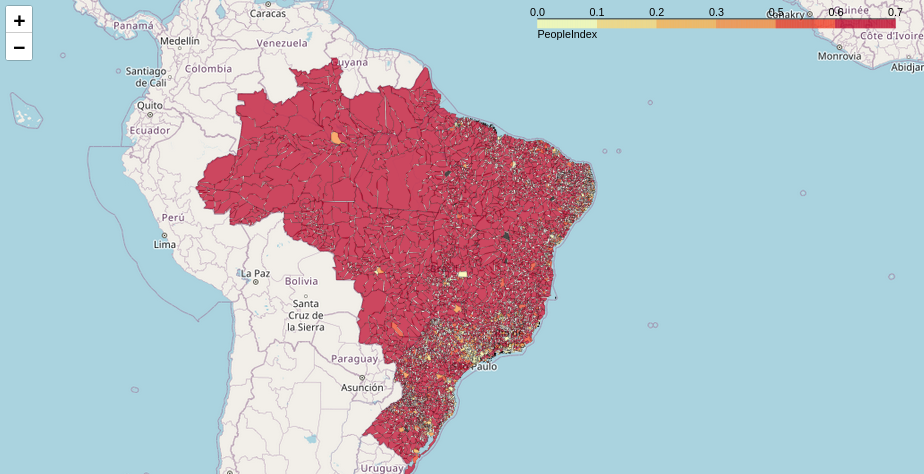
Most of the population lives in a narrow strip close to the coast and in the metropolitan areas around capitals. That means we should move inward to find places with fewer people.
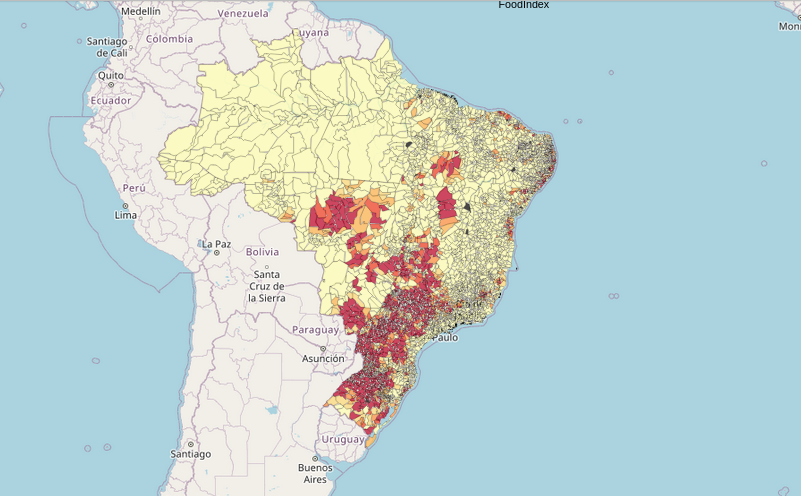
There is little to none food production at the state capitals, which have a more urban environment. Coupled with the higher population density, this means there will be a lot of competition to get the food that is already available, so it is a bad idea to stay at any of the capitals. The country’s food production is mainly in the southern and central regions.
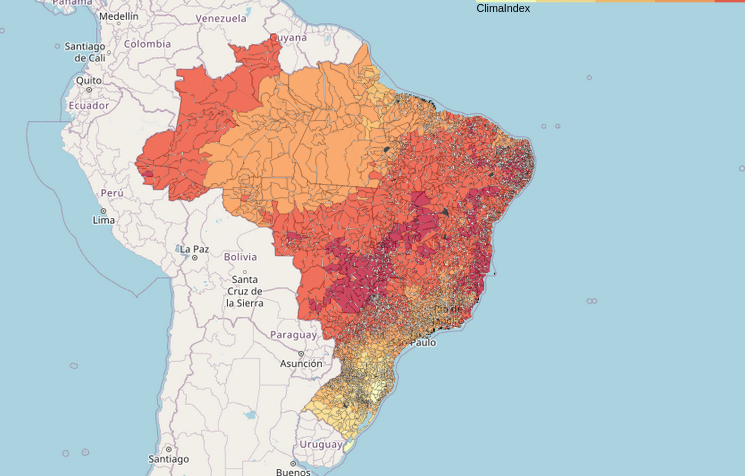
We don’t want to face cold weather or extreme heat, so we should look at temperate climate. It seems that the Central-West and the Northeast regions have the most stable and comfortable weather.
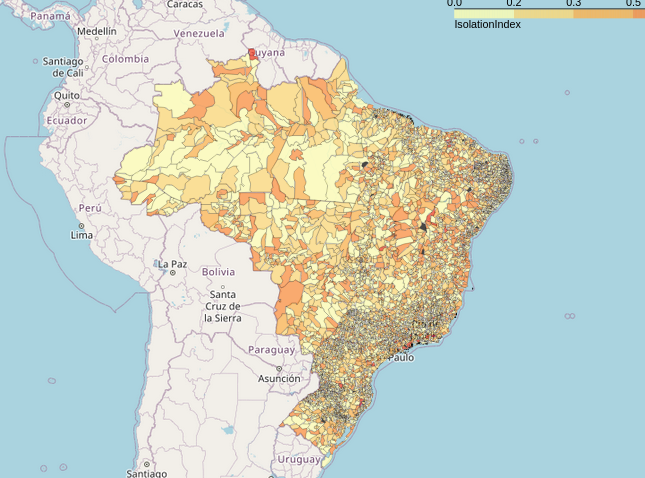
The best place to hide will be hard to reach and where we can see what is around us. That means the top of a mountain or the bottom of a valley.
Most cities have libraries, but the higher learning institutes are mainly on the larger cities, the capitals and the local hubs for each state.
In order to have a quick getaway, we can count on the large number of small airports around the country close to food production hubs, and also large airports at the capitals.
As expected, the bigger the city, more guns are available.
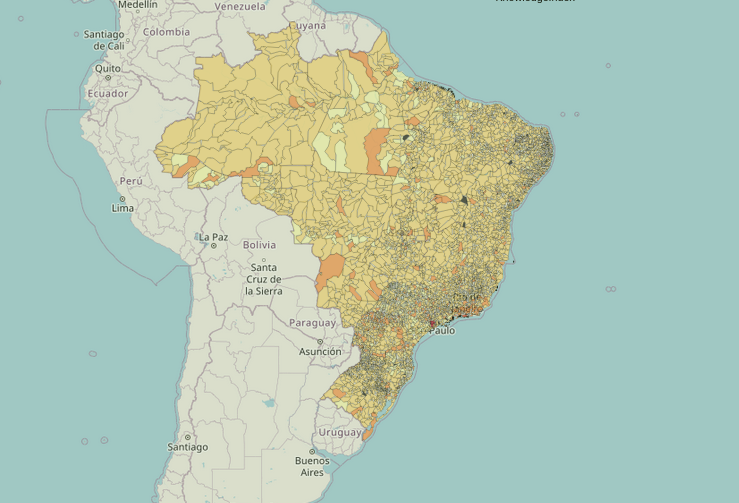
When we consider renewable energy sources, mainly biomass, solar and wind power, the Northeast region is a very good option. We also see the central area of the country getting a lot of electricity from these kinds of sources.
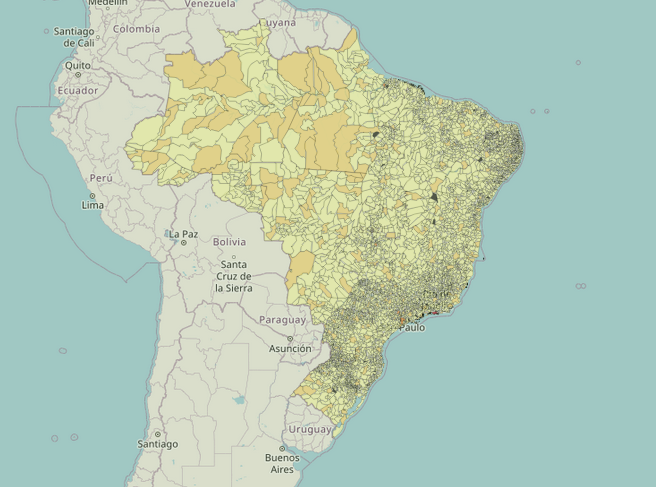
For our Human Survival Index, we gather all this data and see that the best options are scattered around the country, with many of the best cities in the central region, but with a few good options in the Northeast and in the West. Although the state capitals have some of the highest indexes, they are not food producers and they have the highest population densities, so they are not good options.
Final conclusion: We started our project gathering different data sets that could help us to figure out the best city to run to if there is some kind of Apocalypse in Brazil. We ranked the cities according to a set of parameters we deemed necessary to ensure our survival in a range of possible “end of the civilization as we know it” scenarios. After we computed our Scores for every city, we simulated a number of tries to escape from a chosen city and mapped out how they move through the cities. We also saved the sequence of cities that lead to the highest score after a pre-defined number of steps.
Jupyter Notebook available at Github. Interactive panel at Tableau Public.